
 United States
 United Kingdom
 Canada
 Australia
 New Zealand
 Ireland
Petaluma levees stand out on California's flood-risk map
KPIX's UC Davis study walkthrough identifies vulnerable airports, highways and coastal communities from San Luis Obispo to Humboldt Bay.
 KPIX | CBS NEWS BAY AREA
Story of
Why this story? The video opened at a pace of 97,542 views a day, 44 times a normal first day on this channel (2,220).
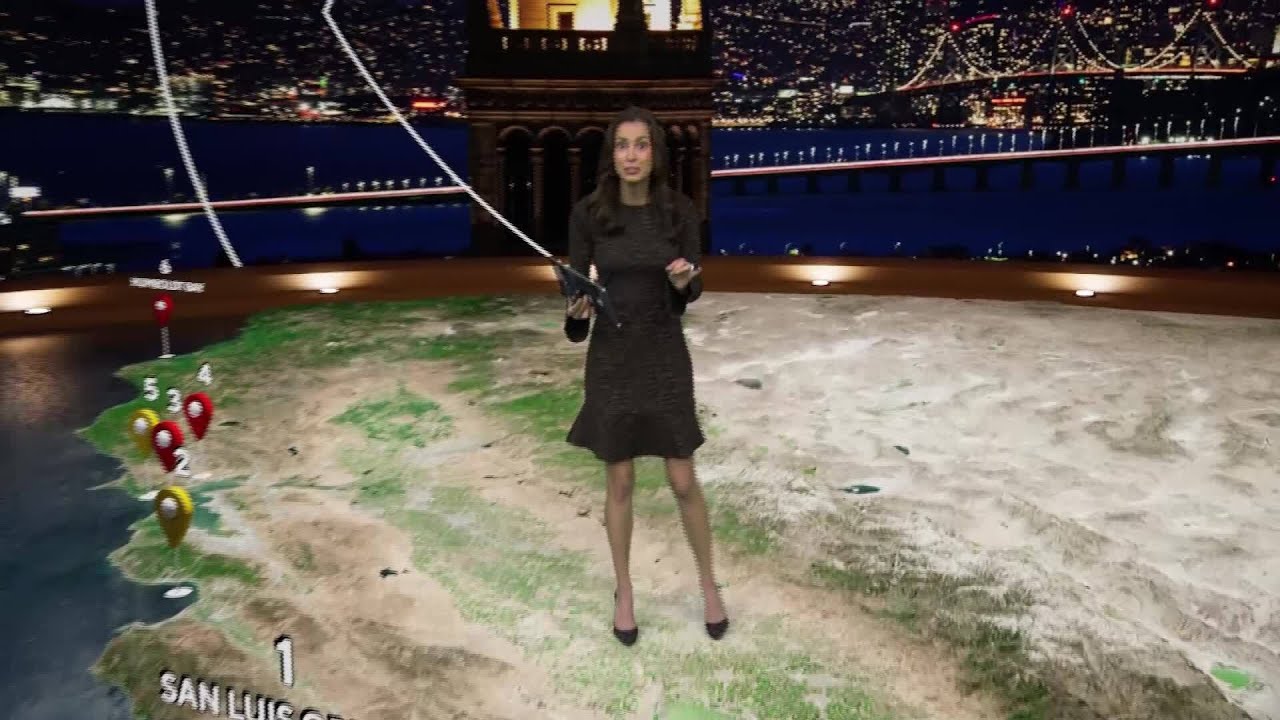 New report details CA's highest-risk infrastructure from El Niño flooding
Things we can learn from the video
Press to jump
- 0:20A digital map introduces six main risk areas between San Luis Obispo and Humboldt Bay.
- 1:03Moss Landing, Highway 1 and Santa Cruz face flooding and beach-erosion risks.
- 1:34Elevated-water scenarios show exposure around SFO, US 101 and South Bay marshes near Alviso.
- 1:57The assessment identifies vulnerable areas around Oakland International Airport and West Oakland.
- 2:38The area east of the Petaluma River faces a highlighted risk of levees overtopping.
- 3:26The walkthrough reaches Humboldt Bay before directing viewers to the interactive map and full report.
KPIX | CBS NEWS BAY AREA takes a wider view of California's flooding problem: not just where water reaches the road, but which roads, airports and levees could become points of failure.
Using a three-dimensional map, the station's meteorologist walks through a UC Davis study of infrastructure vulnerable to El Niño flooding and high tides. The report drew roughly 100,000 views in its first day, far beyond the station's usual audience for a regular upload.
The most pointed warning concerns a small area immediately east of the Petaluma River, where the report highlights a high chance of river levees overtopping. Nearby Lakeville Highway appears on the map. Elsewhere in the North Bay, the assessment flags Highway 37, the San Rafael Canal area and US 101 through Corte Madera.
The airport sections make the potential disruption especially tangible. The map shows exposure around San Francisco International Airport, Oakland International Airport and the South Bay marshes near Alviso under different elevated-water scenarios. These are mapped risks, not footage of those places already underwater.
As we reported here, KPIX has also followed workers building a wooden flood wall in Mill Valley. This report broadens that local picture, tracing coastal erosion and flooding concerns through Pismo Beach, Moss Landing and Santa Cruz before finishing at Humboldt Bay. The presenter also points viewers toward an interactive map so they can explore the locations themselves.
A public research university in the Davis area of California and part of the University of California system.
More on Wikipedia ›The warming phase of a tropical Pacific climate pattern involving changes in ocean temperatures and winds. The pattern influences climate across much of the tropics and subtropics, with links to regions farther away.
More on Wikipedia ›Published on Trari
Where next?


What viewers say
I want one of these maps for my house!
@CynthG-DoRightWomanSee it on YouTubeThank you for making this informative rather than sensational. Much appreciated.
@basque-laperaeuSee it on YouTubeI want a floor like this.
@markalbert9390See it on YouTube
Public comments from the video's page on YouTube
 Is this your channel?For the channel's owners and team: a ready picture and text for your audience
Share the story with your audience. Everything is ready:
For an Instagram story or a WhatsApp status
For a community post or your channel's description
- Channel
- KPIX | CBS NEWS BAY AREA
- Subscribers
- 477,000 ▲ 1,000 this week
- Channel views, last 7 days
- 1,264,987
- Channel views, pace per day
- 206,256 (on a normal day: 147,784)
- Video published
- November 1, 2026
- Video views so far
- 125,309 (2 days online)
- Video views, pace per day
- 107,481
The numbers
The flood-risk report reached an unusually large first-day audience for KPIX. Its comment section was also much busier than on a typical regular upload.

💡 Test your knowledge
Which university produced the infrastructure study featured in this report?
The report presents a UC Davis study identifying California infrastructure vulnerable to flooding.